Infant immunization targets

Data on infant immunization targets – coverage (%) for Hepatitis B (HepB3) and Diphtheria tetanus toxoid and pertussis (DTP3) immunization coverage among 1-year-olds (SDG targets 3.3.4 and 3.b.1) is available for twenty-six countries but not in sex-disaggregated format.

Infant immunization targets

Data on infant immunization targets – coverage (%) for Hepatitis B (HepB3) and Diphtheria tetanus toxoid and pertussis (DTP3) immunization coverage among 1-year-olds (SDG targets 3.3.4 and 3.b.1) is available for twenty-six countries but not in sex-disaggregated format.

Data on infant immunization targets – coverage (%) for Hepatitis B (HepB3) and Diphtheria tetanus toxoid and pertussis (DTP3) immunization coverage among 1-year-olds (SDG targets 3.3.4 and 3.b.1) is available for twenty-six countries but not in sex-disaggregated format.  The average for the Western Pacific Region was 93% for Hepatitis B and 97% for the DPT3 vaccinations (2017).

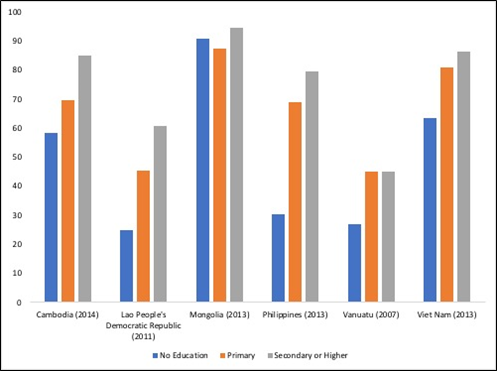
As discussed throughout, improved education for women is associated with better health for them, their children and their grandchildren (201).  Figure 16 highlights differences in the impact of inequalities in maternal education for children living in different countries in the Region (15,202–206). For example, there is a much steeper gradient in inequalities for children born to women with no education in the Philippines, the Lao PDR and Cambodia compared to Mongolia where the difference between all three levels of education is far less.  In Mongolia however the children of mothers with no education have a slightly higher coverage rate compared to children whose mothers have primary education.  This might reflect the impact a campaign to reach mothers with no education which may have unintentionally created inequalities among the children born to mothers with primary education.

Figure 16. Full immunization coverage rates among 1-year olds (%) by mother’s education level, selected countries, Western Pacific Region, various years (15,202–206)

References

  1. National Institute of Statistics, Directorate General for Health, ICF International. Cambodia Demographic and Health Survey 2014. Phnom Penh, Cambodia, and Rockville, Maryland, USA, National Institute of Statistics, Directorate General for Health, and ICF International., 2014.
  1. Health equity monitor [web site]., 2019 (https://www.who.int/gho/health_equity/en/, accessed 1 July 2019).
  2. Lao PDR. Lao Social Indicator Survey (LSIS) 2011 – 12 (MULTIPLE INDICATOR CLUSTER SURVEY / DEMOGRAPHIC AND HEALTH SURVEY). Lao, 2012 (https://dhsprogram.com/pubs/pdf/FR268/FR268.pdf).
  3. National Statistical Office of Mongolia, UNICEF, UNFPA. Social Indicator Sample Survey – 2013. Multiple Indicator Cluster Survey. Ulaanbaatar, Mongolia, National Statistical Office, 2015 (https://mics-surveys-prod.s3.amazonaws.com/MICS5/East%20Asia%20and%20the%20Pacific/Mongolia/2013-2014/Final/Mongolia%202013-14%20MICS-SISS_English.pdf).
  4. Philippine Statistics Authority (PSA), ICF International. Philippines National Demographic and Health Survey, 2013. Manila, PSA and ICF., 2014 (https://www.dhsprogram.com/publications/publication-fr294-dhs-final-reports.cfm).
  5. UNICEF, Ministry of Health. Vanuatu Multiple Indicator Cluster Survey, 2007. Vanuatu, Vanuatu Ministry of Health, UNICEF, 2008 (https://mics-surveys-prod.s3.amazonaws.com/MICS3/East%20Asia%20and%20the%20Pacific/Vanuatu/2007-2008/Final/Vanuatu%202007%20MICS_English.pdf, accessed 19 July 2019).
  6. UNICEF, Viet Nam General Statistics Office. Multiple Indicator Cluster Survey 2013-2014 Vietnam, 2013 – 2014. Hanoi, UNICEF, Vietnam General Statistics Office, 2015 (https://microdata.worldbank.org/index.php/catalog/2524).


Please note:

This site is not currently supported on Internet Explorer at this time. Please use a browser such as Chrome, Safari or Edge.